RNA Sequencing 
Product Introduction
The transcriptome refers to the complete set of RNA transcripts produced within a cell, including mRNAs, non-coding RNAs, and other RNA molecules. The transcriptome exhibits spatial and temporal specificity, enabling the study of gene functions, regulatory mechanisms, and molecular changes at the transcriptional level. Transcriptome sequencing (RNA-seq) utilizes high-throughput sequencing technologies to profile transcriptome-wide RNA expression patterns. By analyzing changes in gene expression and transcript structures, RNA-seq enables the exploration of disease mechanisms, identification of potential therapeutic targets, support for drug development, and guidance of clinical decision-making.
Technical Parameters
detection method


mRNATotal RNA RNA ExomemiRNA
Technical Roadmap
PolyT bead capturerRNA Depletionprobe capturemiRNA enrichment
Sample TypeFresh/frozen cells, tissue, whole bloodFresh/frozen cells, tissue, whole blood

FFPE samples

Low initial RNA samples
Fresh or frozen samples: cells, tissues, blood, exosomes
Specieseukaryotic organismsHuman, mouse, rat Human beingseukaryotic organisms
ApplicationmRNA expression

mRNA +

lncRNA + 

circRNA expression

mRNA expressionmiRNAexpression

Other Applications

Gene fusion

Alternative Splicing

Allele-specificexpression

Gene fusion

Alternative Splicing

Allele-specificexpression

Gene fusion

Alternative Splicing

Allele-specificexpression

/
Seq Data Requirement6 – 8 Gb12 – 15 Gb6 – 8 Gb3Gb
RIN Value≥ 7≥ 7//
RNA Input Volume≥ 200 ng≥ 200 ng≥ 40 ng≥ 200 ng
DV200(%)≥ 70%≥ 70% 30%/
sample
>50,000>10,000>20,000>1,000
ValidationbloodbloodFFPE/


Sample Requirements


SampleType
RequirementStorage & Transportation
RNA

>1μg

In TE buffer, no degradation, no protein and DNA contamination

-80°C, Dry ice
blood

≥ 5mL whole blood

PAXgen Blood RNA tube, mixing before storage

-80°C, Dry ice
Tissue

>10mg fresh frozen tissue samples

Cut to<0.5cm immediately, in 5 times of RNAlater, 4°C overnightbefore long term storage

-80°C, Dry ice
Cell

≥1×10⁶cells

centrifugation, washed by PBS twice, storage in 1ml Trizol lysisbuffer

-80°C, Dry ice
FFPE

10 Slides

Volume >0.6 mm3

Room temperature


*For other sample types, please contact us via email at info@sequanta.com.
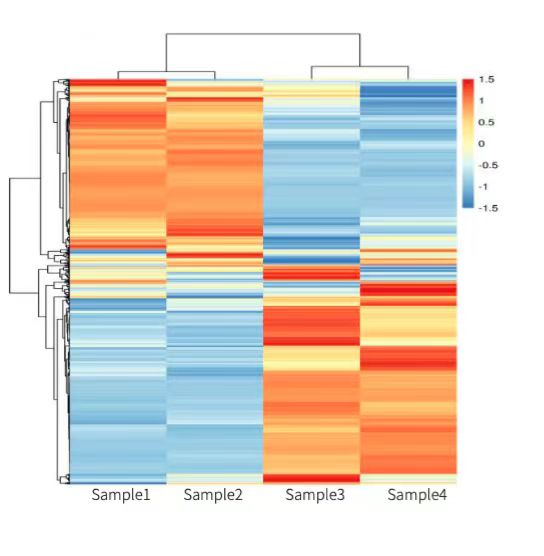
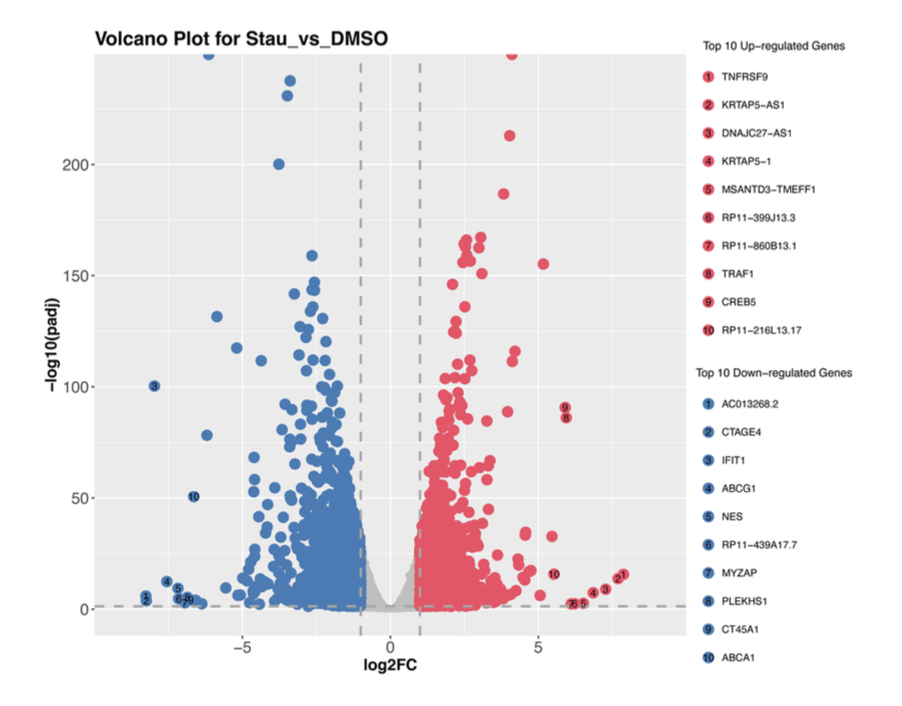
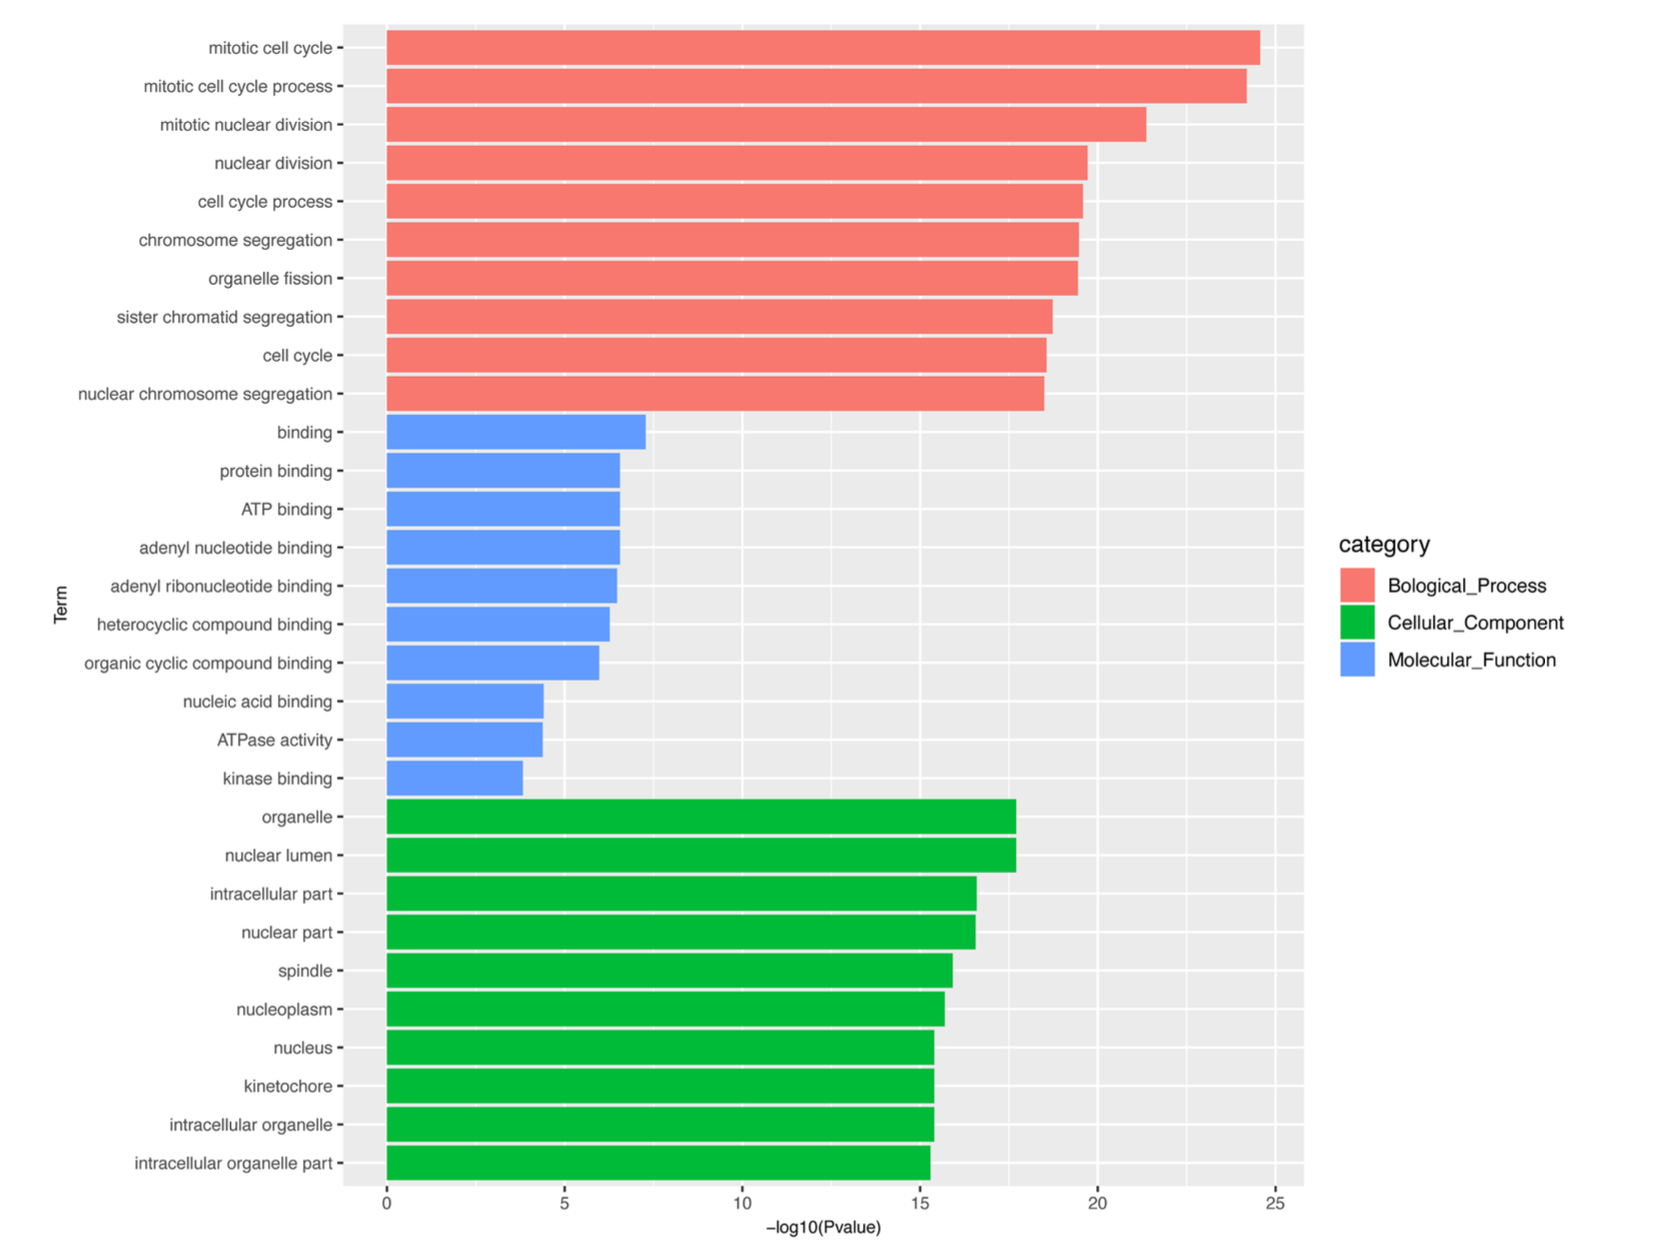
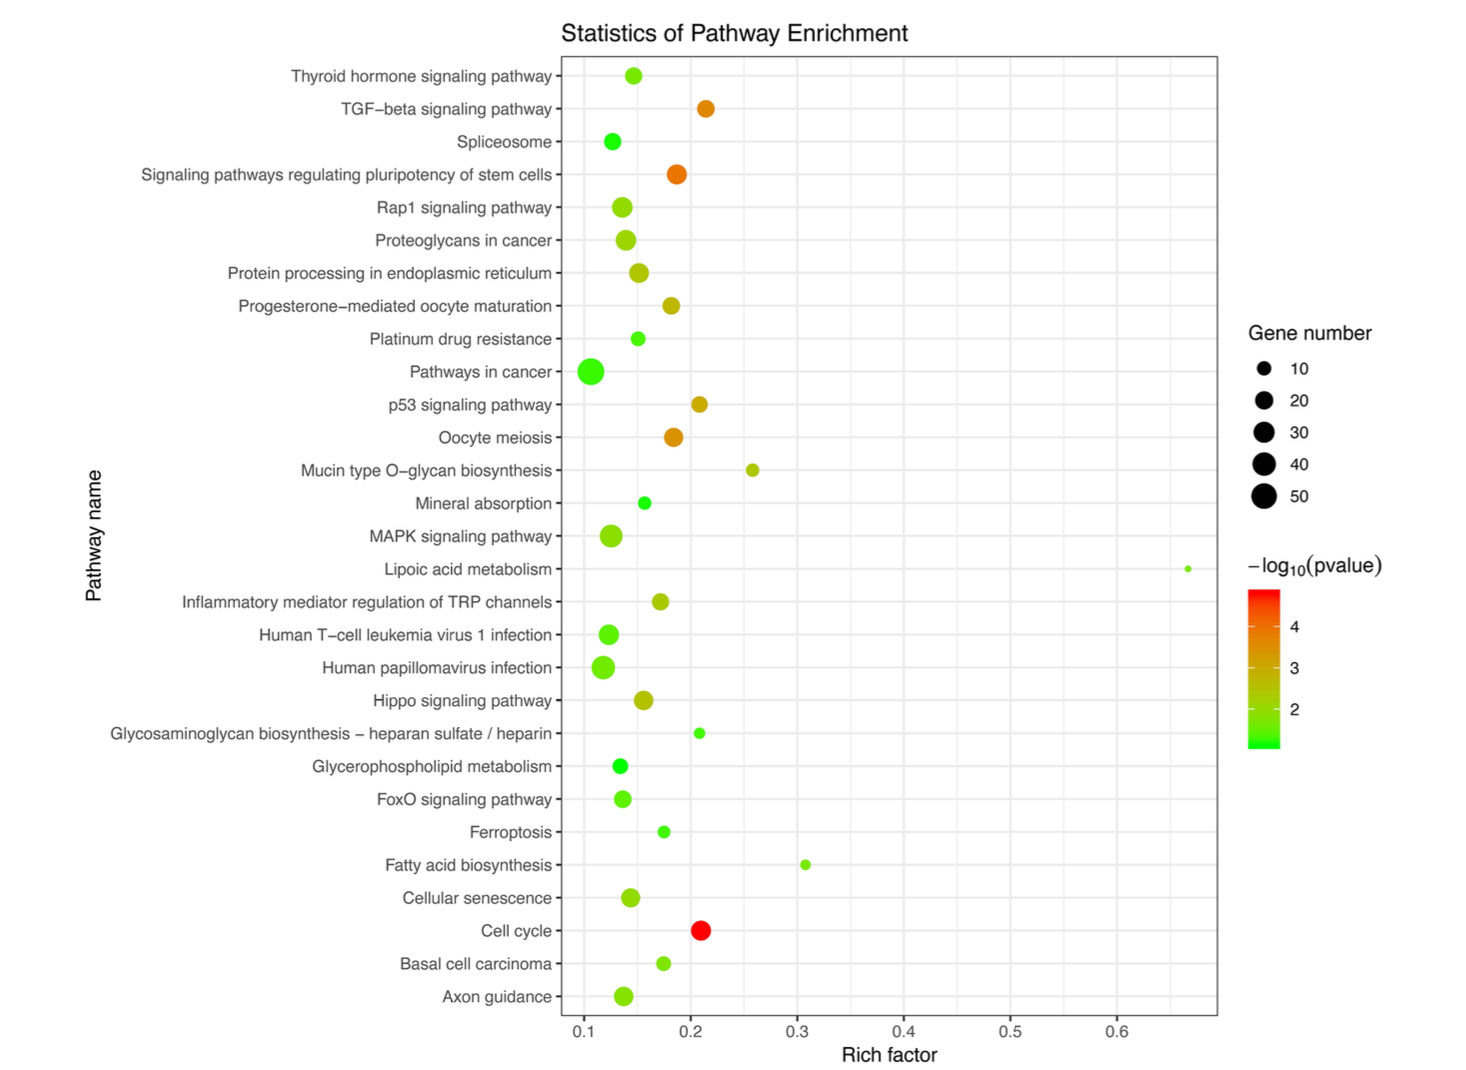
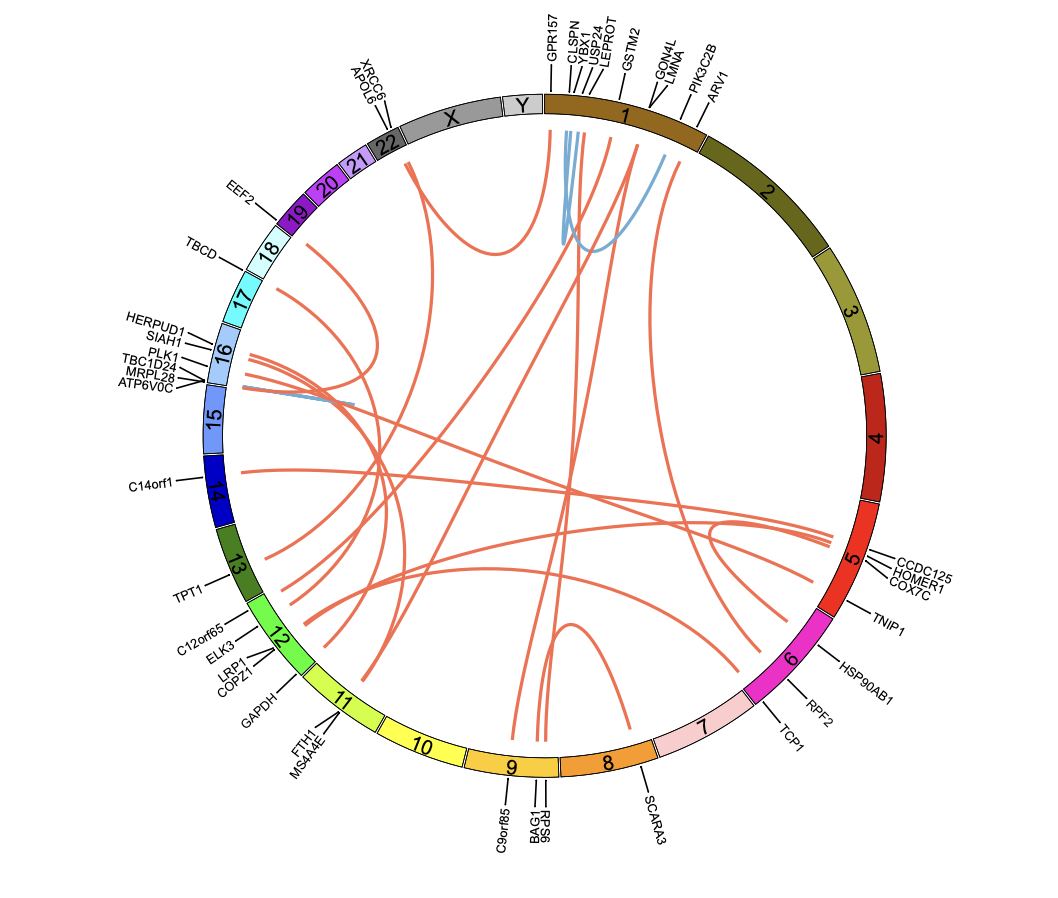
The results are shown in Figure.
描述
The gene expression clustering heatmap shows sample clustering along the horizontal axis and gene clustering along the vertical axis. Samples or genes grouped within the same branch of the dendrogram exhibit higher similarity. The color intensity represents the relative expression level of each gene at the corresponding position, with red indicating higher expression and blue indicating lower expression.
描述
The x-axis of the volcano plot represents the log2 fold change in gene expression between two groups, while the y-axis represents the statistical significance of differential gene expression. Each dot represents a gene, with red dots indicating significantly upregulated genes, blue dots indicating significantly downregulated genes, and gray dots representing genes without significant differences. The panel on the right shows the top 10 most significantly upregulated and downregulated genes (if fewer than 10 differentially expressed genes are identified, all available genes are displayed).
描述
The plot shows the top 10 most significantly enriched GO terms across the three GO categories. Different GO categories are indicated by different colors. The bar length represents the enrichment significance, with longer bars indicating more significant enrichment.
描述
The y-axis of the KEGG pathway enrichment plot represents the names of pathways enriched by differentially expressed genes (DEGs). The bubble color indicates the significance of pathway enrichment, with increasing significance from green to red. The bubble size represents the number of overlapping DEGs between the identified genes and pathway-associated genes, with larger bubbles indicating more overlapping DEGs. The x-axis represents the Rich Factor, which is calculated based on the ratio of overlapping DEGs to the total number of genes annotated in the corresponding pathway. A higher Rich Factor indicates a greater enrichment level of DEGs in the pathway.
描述
The chromosomal distribution of the top 20 fusion genes identified in the fusion gene map. The outermost circle indicates chromosome numbers, and each line connects the two genes involved in a fusion event. Red lines indicate interchromosomal fusion events, whereas blue lines indicate intrachromosomal fusion events.